MATH 1830 Notes

Unit 3 Applications of Derivatives

3.2 First Derivative Test

Pre-Class:

First Derivative Test

Analyze $f'(x)$ to Identify Intervals of Increase/Decrease and Extrema on the Graph of $f(x).$

  1. Find $f'(x)$
  2. Identify all critical numbers and partitions for the function.
    1. Values of $x$ where$f'(x)=0$ are critical numbers.
    2. Values of $x$ where $f'(x)$ is undefined are partitions.
    3. Values of $x$ where $f(x)$ is undefined are partitions.
  3. Graph the critical numbers and partitions on a number line, separating the number line into intervals.
  4. Determine the intervals on which $f(x)$ is increasing /decreasing
    1. Test one point contained in the interval (do not use the end points of the interval).
    2. $f'(x)<0$ then the function $f(x)$ is DECREASING on the interval
    3. $f'(x)>0$ then the function $f(x)$ is INCREASING on the interval
  5. Identify local maxima and minima of $f(x)$ using the First Derivative Test.
    1. On the interval $(a,c)$, a local maximum occurs at $f(b)$ when $f(x)$ is increasing for all $x$ in the interval $(a,b]$ and $f(x)$ is decreasing for all $x$ in the interval $[b,c)$.
    2. On the interval $(a,c)$, a local minimum occurs at $f(b)$ when $f(x)$ is decreasing for all $x$ in the interval $(a,b]$ and $f(x)$ is increasing for all $x$ in the interval $[b,c)$.

Use the First Derivative Test to analyze the function. Identify intervals of increase/decrease and extrema on the graph of the function.

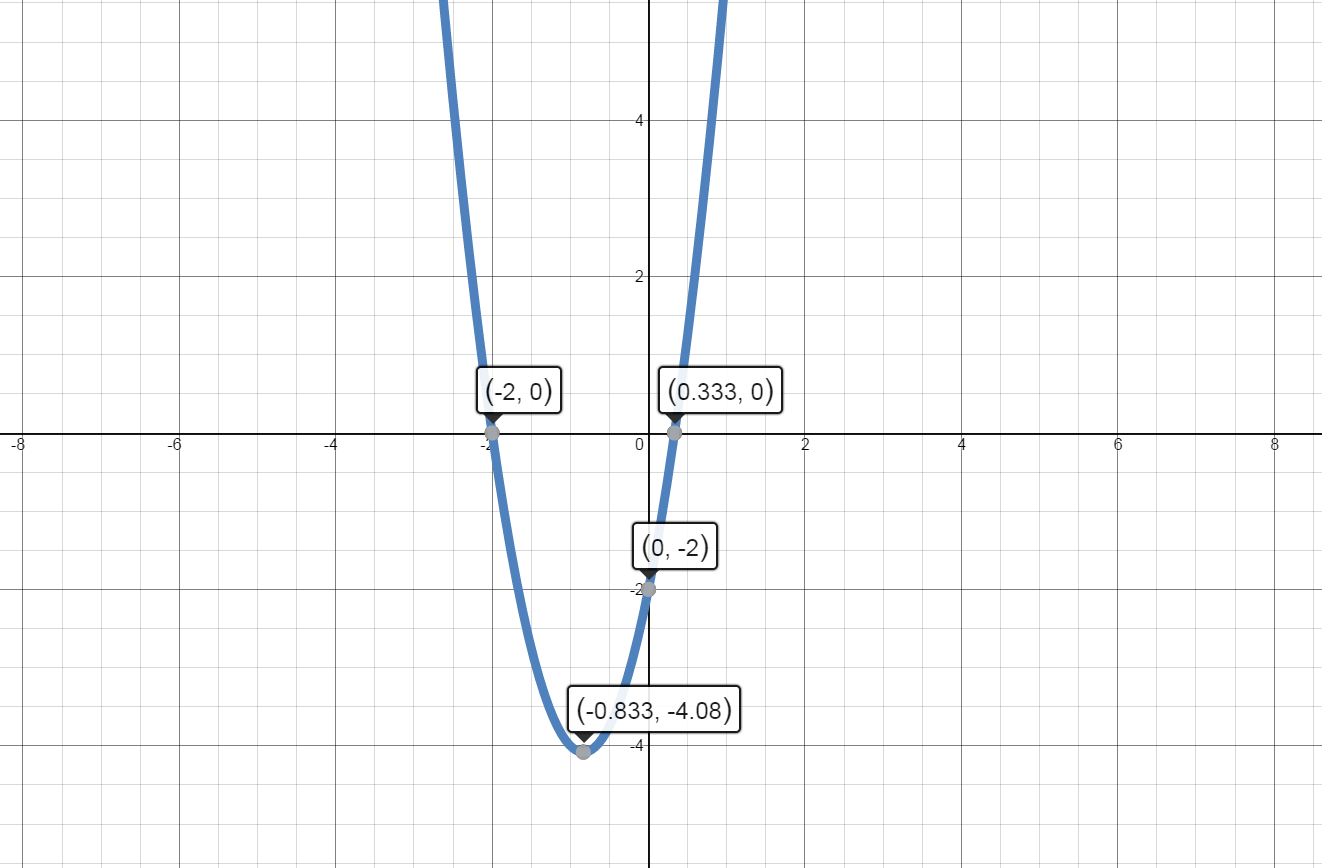
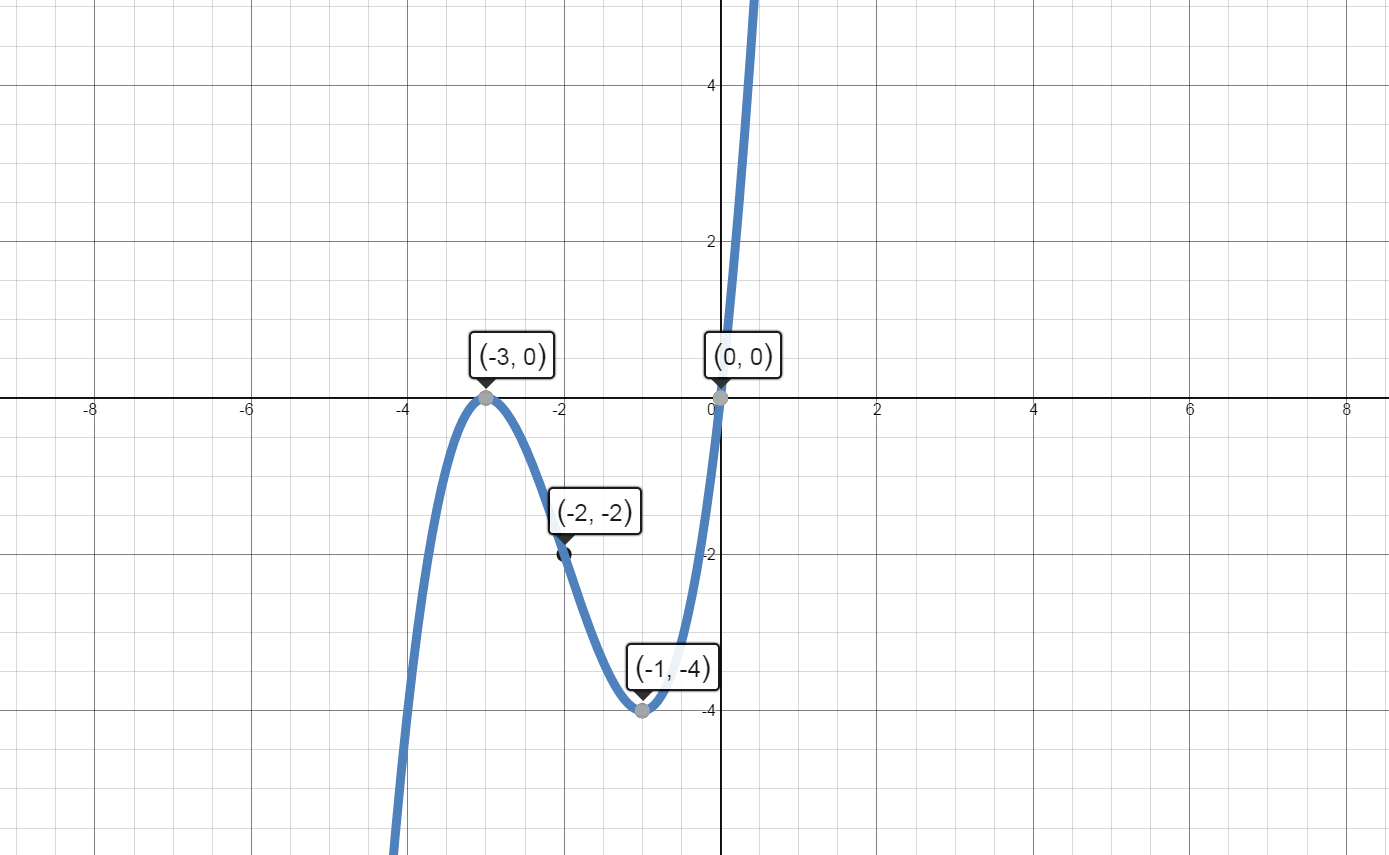
  1. $f(x)={{x}^{3}}+6{{x}^{2}}+9x$

    1. Increasing and Decreasing

      ${f}'(x)=3{{x}^{2}}+12x+9$

      Values of x where ${f}'(x)=0: \quad 3{{x}^{2}}+12x+9=0$

      $3\left( x+3 \right)\left( x+1 \right)=0$

      $3 \neq 0$

      $x=-3$

      $x=-1$

      Values of x where ${f}'\left( x \right)$ is undefined:

      There are no values of x where ${f}'\left( x \right)$ is undefined.

      Values of x where $f\left( x \right)$ is undefined:

      There are no values of x where $f\left( x \right)$ is undefined.

      Separate into intervals using: $x=-3$ and $x=-1$.

      Image of graph of F prime of x as it relates to the x axis. Separates graph into intervals divided by partitions where F prime equals zero, or is undefined.  Also indicates intervals where derivative is positive and intervals where derivative is negative.
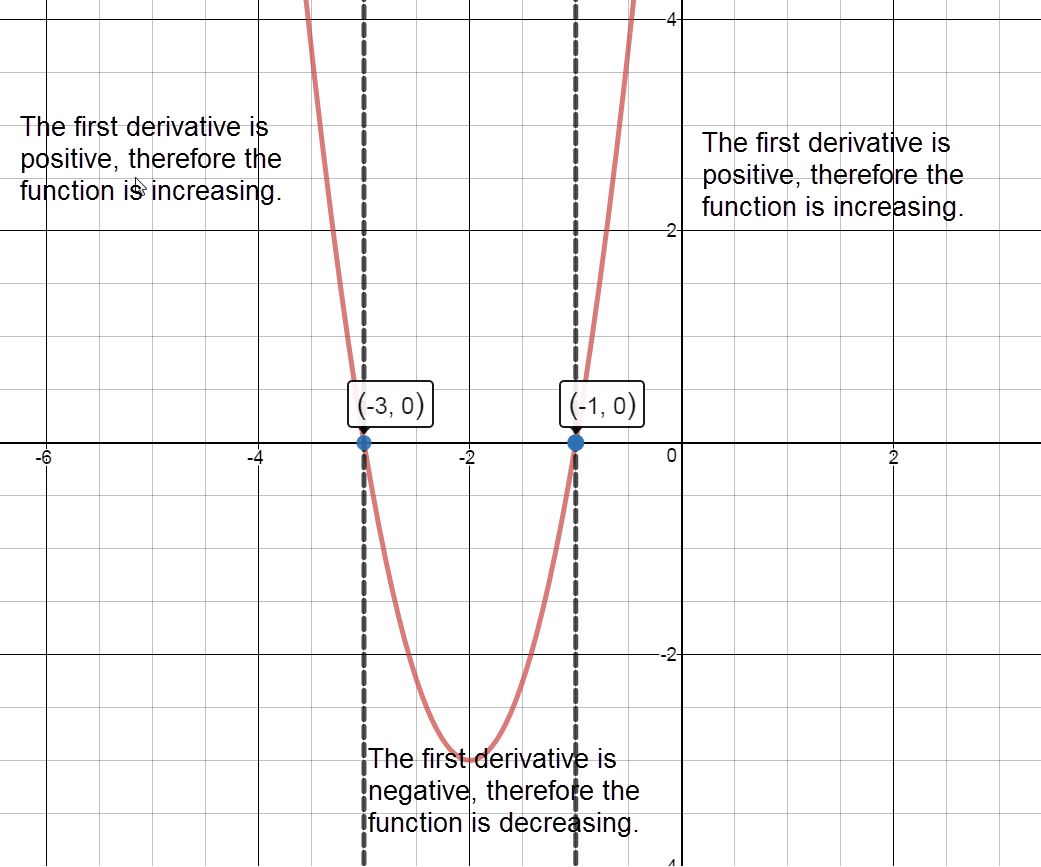
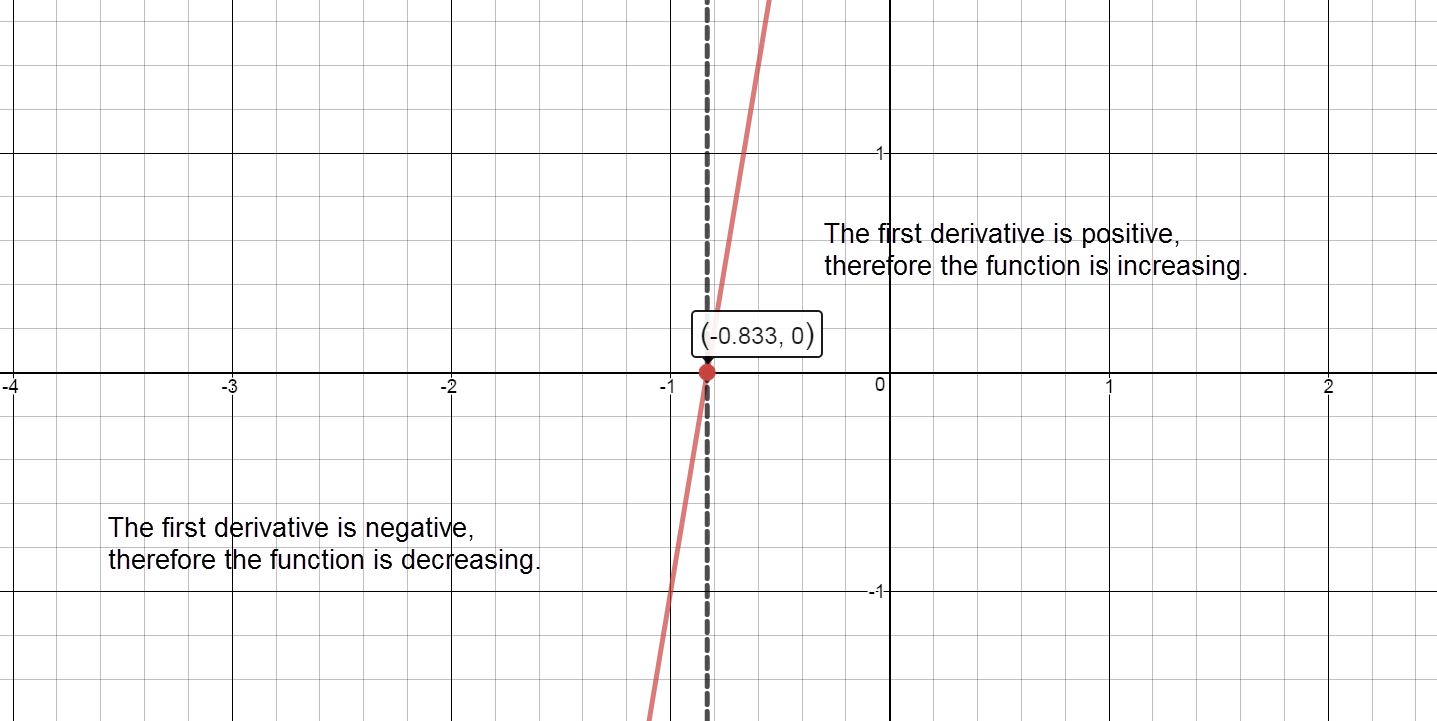
      Sign graph of ${f}'(x)$ reading left to right: positive, ${f}'\left( -3 \right)=0$, negative, ${f}'\left( -1 \right)=0$, positive

      Increasing:

      The graph of $f(x)$ is increasing on the intervals $\left( -\infty ,-3 \right)\cup \left( -1,\infty \right)$.

      Decreasing:

      The graph of $f(x)$ is decreasing on the interval $\left( -3,-1 \right)$.

    2. Local Maxima:

      $f\left( -3 \right)={{\left( -3 \right)}^{3}}+6{{\left( -3 \right)}^{2}}+9\left( -3 \right)=0$

      There is a local maximum at the point $\left( -3,0 \right)$.

      Local Minima:

      $f\left( -1 \right)={{\left( -1 \right)}^{3}}+6{{\left( -1 \right)}^{2}}+9\left( -1 \right)=-4$

      There is a local minimum at the point $\left( -1,-4 \right)$.

      blank 4 quadrant coordinate plane

      Graph of F of x indicating intervals of increase, intervals of decrease, local maxima and local minima

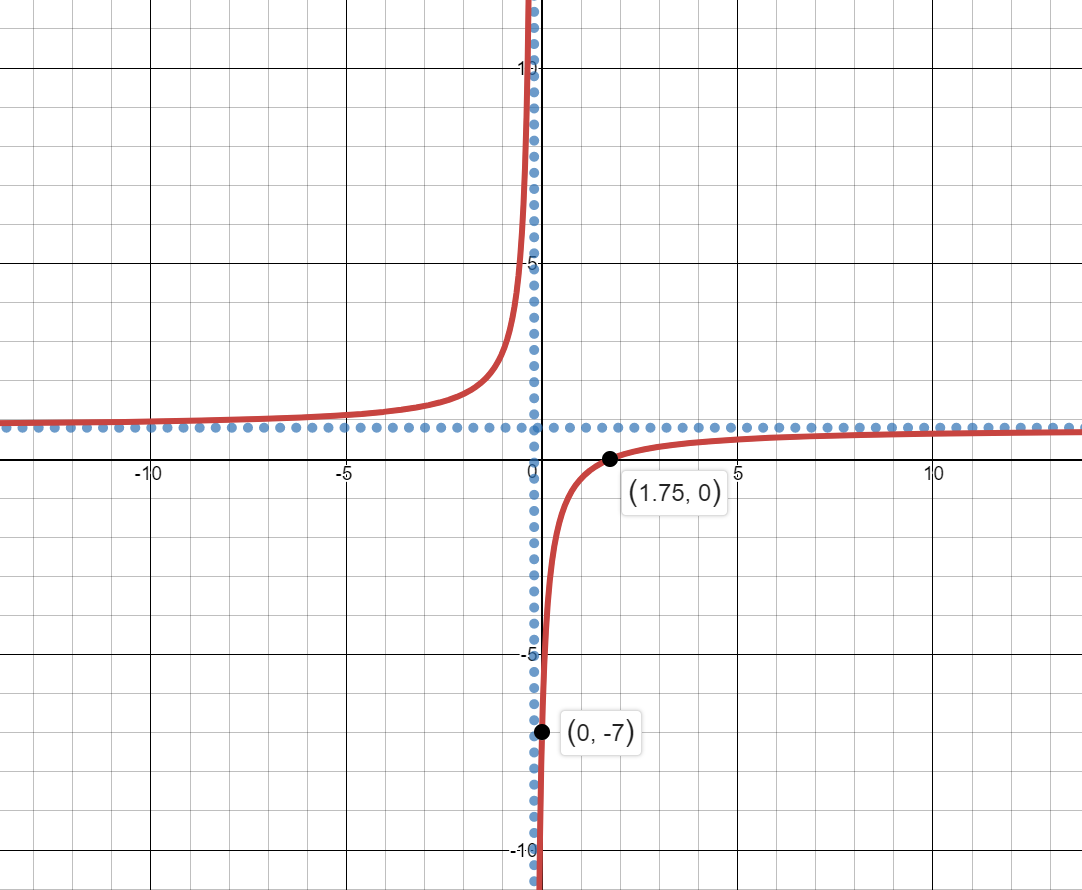
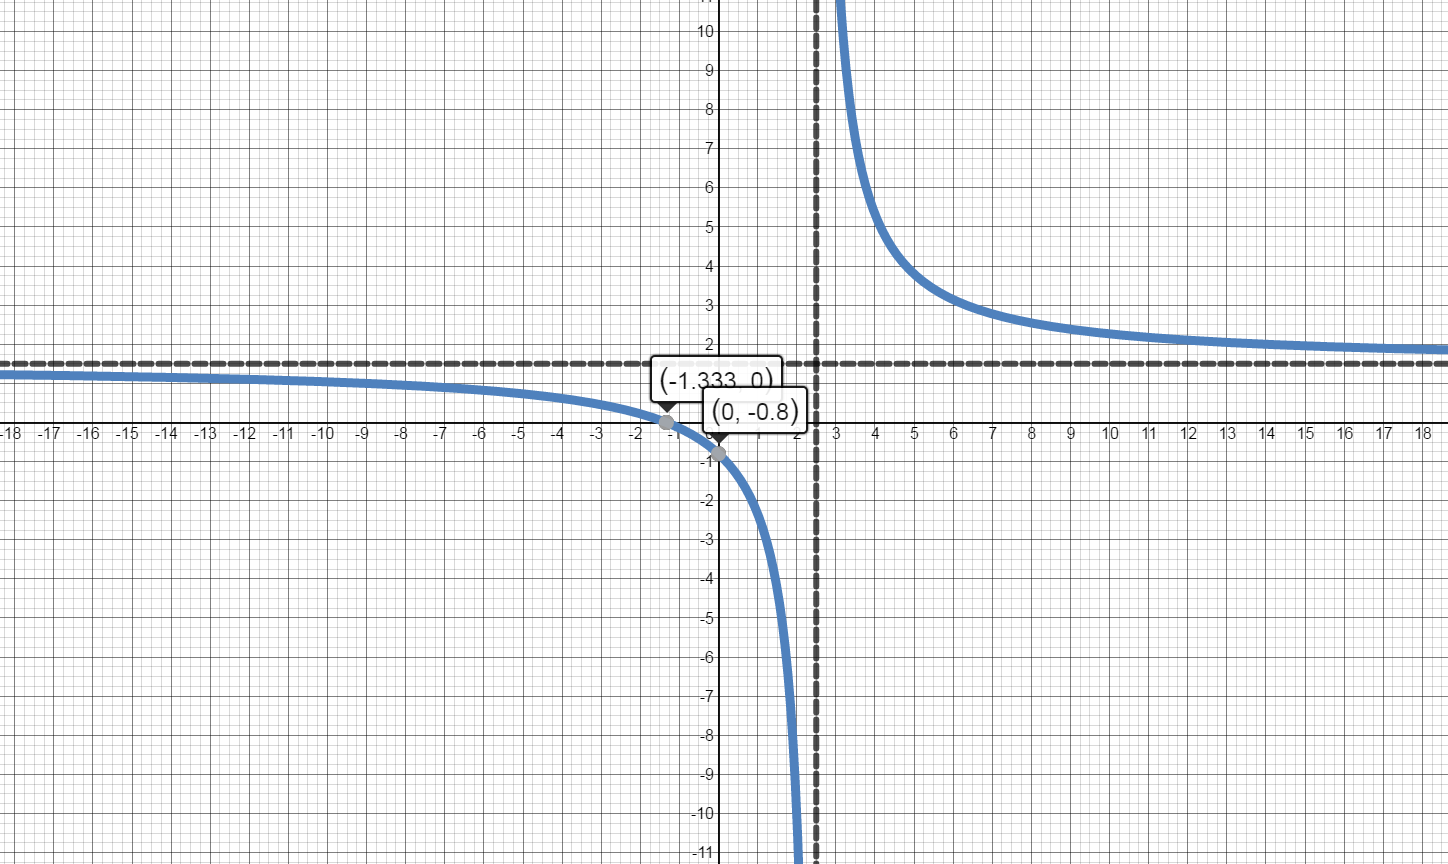
  2. $f(x)=\frac{3x+4}{2x-5}$

    1. Increasing and Decreasing

      ${f}'\left( x \right)=\frac{3\left( 2x-5 \right)-2\left( 3x+4 \right)}{{{\left( 2x-5 \right)}^{2}}}=\frac{6x-15-6x-8}{{{\left( 2x-5 \right)}^{2}}}=\frac{-23}{{{\left( 2x-5 \right)}^{2}}}$

      Values of x where ${f}'\left( x \right)=0:$

      $\frac{0}{1}=\frac{-23}{{{\left( 2x-5 \right)}^{2}}}$

      $-23 \neq 0$. There are no values of x where ${f}'\left( x \right)=0.$

      Values of x where ${f}'\left( x \right)$ is undefined:

      $2x-5=0$, $ x=\frac{5}{2}$

      Values of x where $f\left( x \right)$ is undefined:

      $2x-5=0$, $x=\frac{5}{2}$

      Separate into intervals using: $x=\frac{5}{2}$.

      Image of graph of F prime of x as it relates to the x axis. Separates graph into intervals divided by partitions where F prime equals zero, or is undefined.  Also indicates intervals where derivative is positive and intervals where derivative is negative.
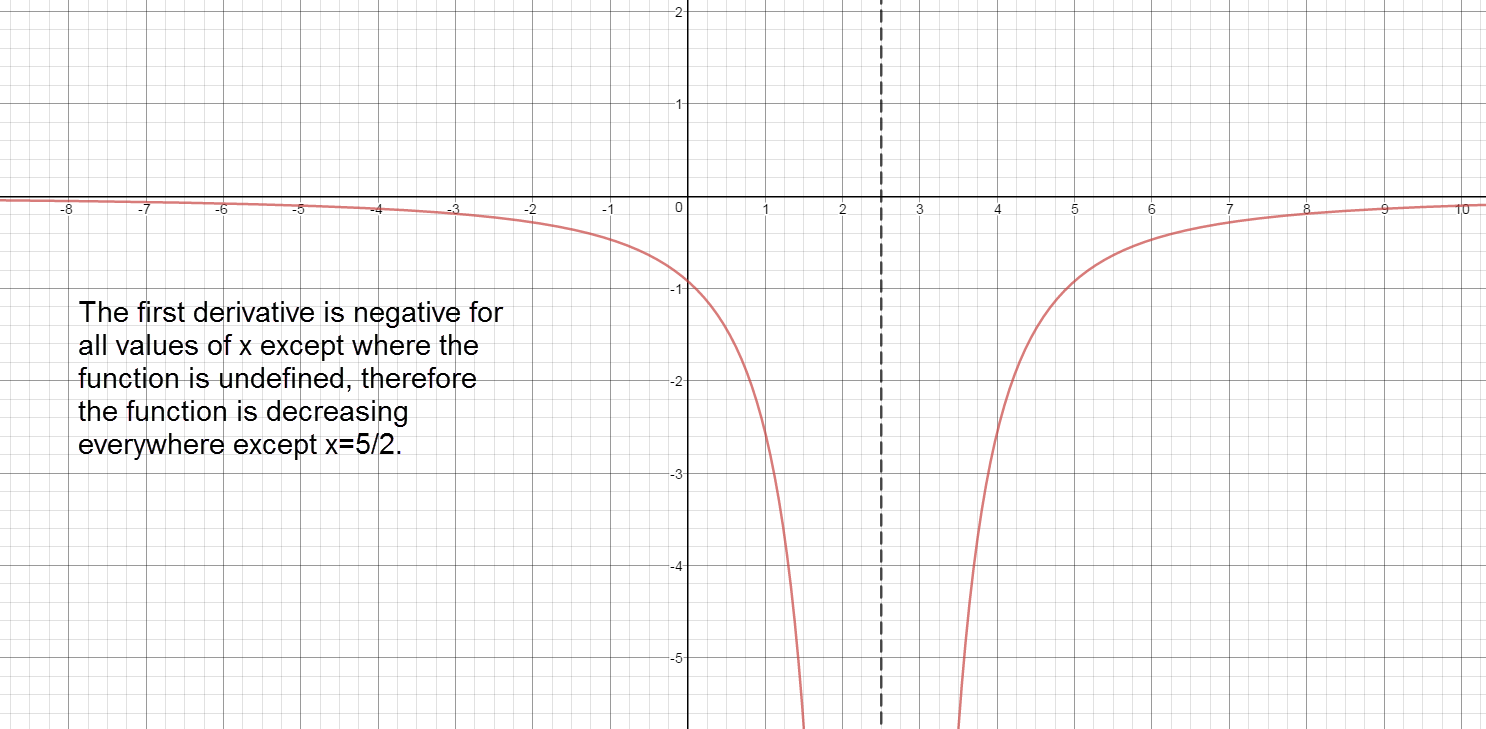
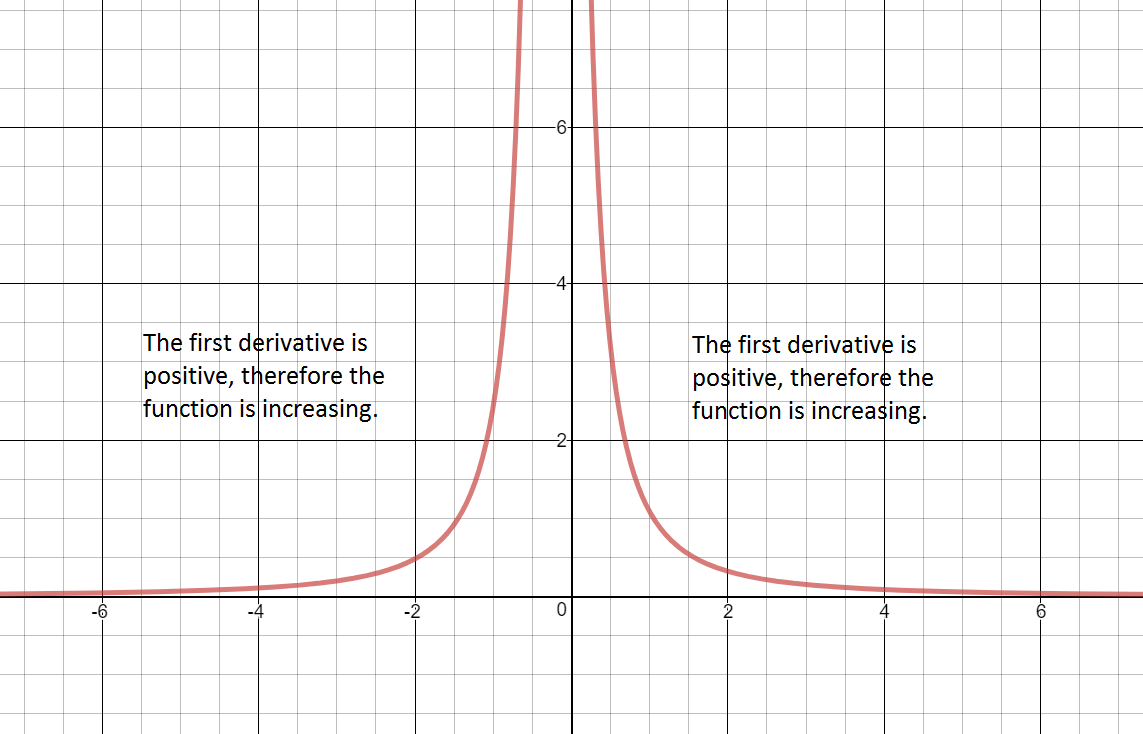
      Sign graph of ${f}'(x)$ reading left to right: negative, ${f}'\left( \frac{5}{2} \right)\text{= undefined}$, negative

      Increasing:

      The graph of the first derivative is never above the x axis. Therfore, there are no intervals where $f(x)$ is increasing.

      Decreasing:

      $\left( -\infty ,\frac{5}{2} \right)\cup \left( \frac{5}{2},\infty \right)$ The graph of the first derivative is always below the x axis. Therefore, the function is decreasing over the entire domain.

    2. Local Maxima:

      The first derivative never changes from positive to negative. There are no local maxima.

      Local Minima:

      The first derivative never changes from negative to positive. There are no local minima.

      blank 4 quadrant coordinate plane

      Graph of f of x indicating intervals of increase, intervals of decrease, local maxima and local minima

  3. The annual first quarter change in revenue for Apple, Inc. is given by the regression model: $$f(x)=-0.005x^4+0.113x^3-0.889x^2+7.946x-5.346$$ where x is Years Since 1998.

    Use the First Derivative Test to analyze $f'(x)$ and identify intervals of increase/decrease and extrema on the graph of $f(x)$.

    $f'(x)=-0.02x^3+0.339x^2-1.778x+7.946$

    1. Create the sign chart for $f'(x)$:

      Identify the values of x where $f'(x)=0$:

      $f'(x)=0$ at $x=12.358$

      Values of x where $f'(x)$ is undefined:

      There are no values of x where $f'(x)$ is undefined.

      Values of x where $f(x)$ is undefined:

      There are no values of x where $f(x)$ is undefined.

      Separate the graph of $f'(x)$ into intervals using: $x=12.358$.

      graph of first derivative
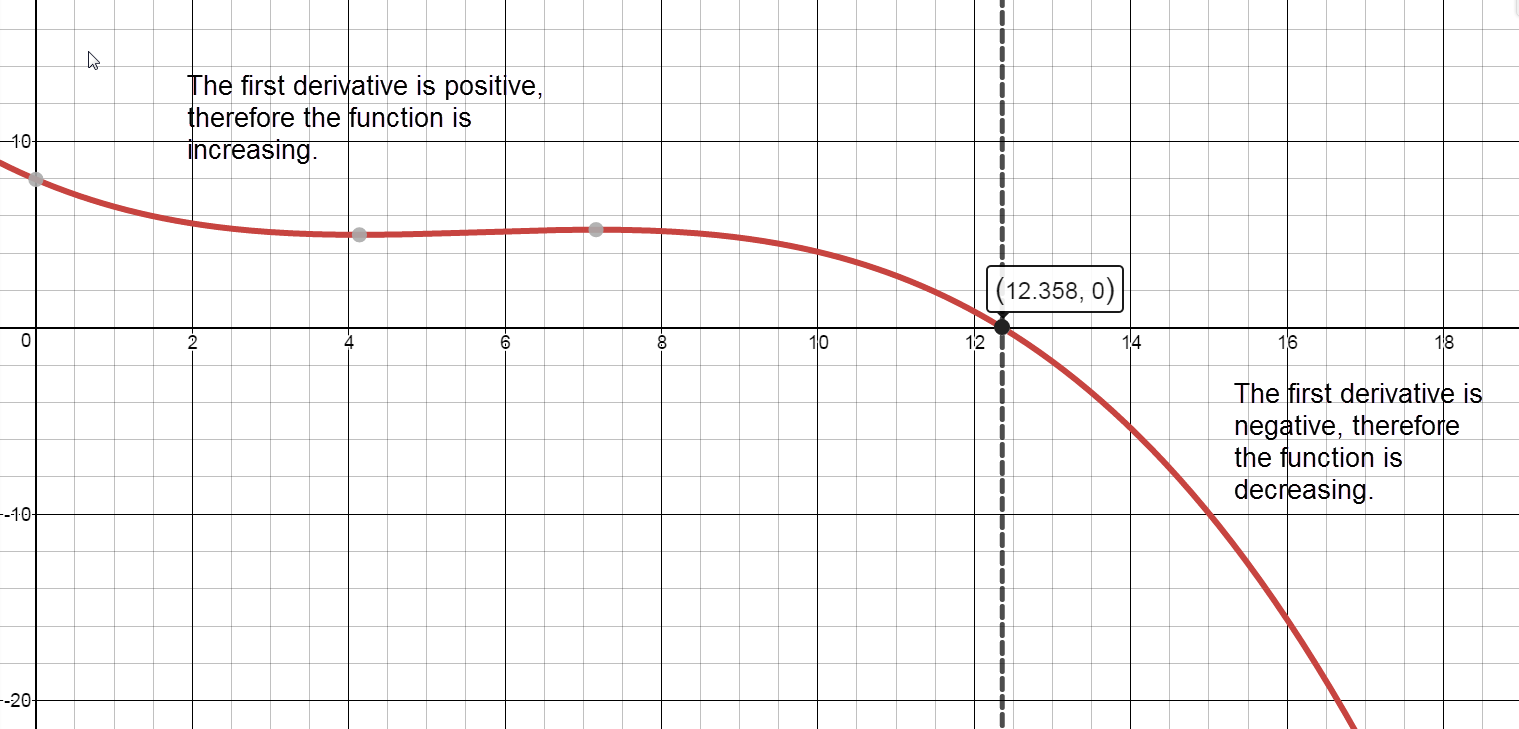
      Sign graph of ${f}'(x)$ reading left to right: positive, ${f}'\left( 12.358 \right)=0$, negative

      Intervals of Increase and Intervals of Decrease

      Increasing:

      $[0,12.358)$

      The percent change in revenue was increasing from 1998 into 2010.

      Decreasing:

      $(12.358,18]$

      The percent change in revenue was decreasing in 2010 through 2016.

    2. Extrema

      Local maximum:

      $(12.358, 53.732)$

      From the model, the maximum percent change in revenue occurs in 2010 (at x=12.358 years after 1998).

      Local minimum:

      There are no local minima.

  4. Using data from the Federal Reserve, the Dow S&P 500 annual percent return on investments for the years 2008-2014 can be modeled by the following equation: $$A(t) = - 1.64{t^4} + 20.85{t^3} - 86.05{t^2} + 127.87t - 36.24$$ where t is in years since 2008 and A(t) is in percent.

    Source: http://pages.stern.nyu.edu/~adamodar/New_Home_Page/datafile/histretSP.html

    Use the First Derivative Test to analyze $A'(t)$ and identify intervals of increase/decrease and extrema on the graph of $A(t)$.

    ${A}'\left( t \right)=-6.56{{t}^{3}}+62.55{{t}^{2}}-172.10t+127.87$

    1. Graph the critical numbers on a number line and determine the sign for each interval.

      Values of t where ${A}'\left( t \right)=0$:

      $0=-6.56{{t}^{3}}+62.55{{t}^{2}}-172.10t+127.87$

      ${A}'\left( t \right)=0$ when $t\approx 1.20$, $t\approx 3.10$, $t\approx 5.23$

      Values of t where ${A}'\left( t \right)$ is undefined:

      There are no values of t where ${A}'\left( t \right)$ is undefined.

      Values of t where ${A}\left( t \right)$ is undefined:

      There are no values of t where ${A}\left( t \right)$ is undefined.

      Separate into intervals using: $t=1.20$, $t=3.10$ and $t=5.23$.

      Graph of the first derivative of the function A of t
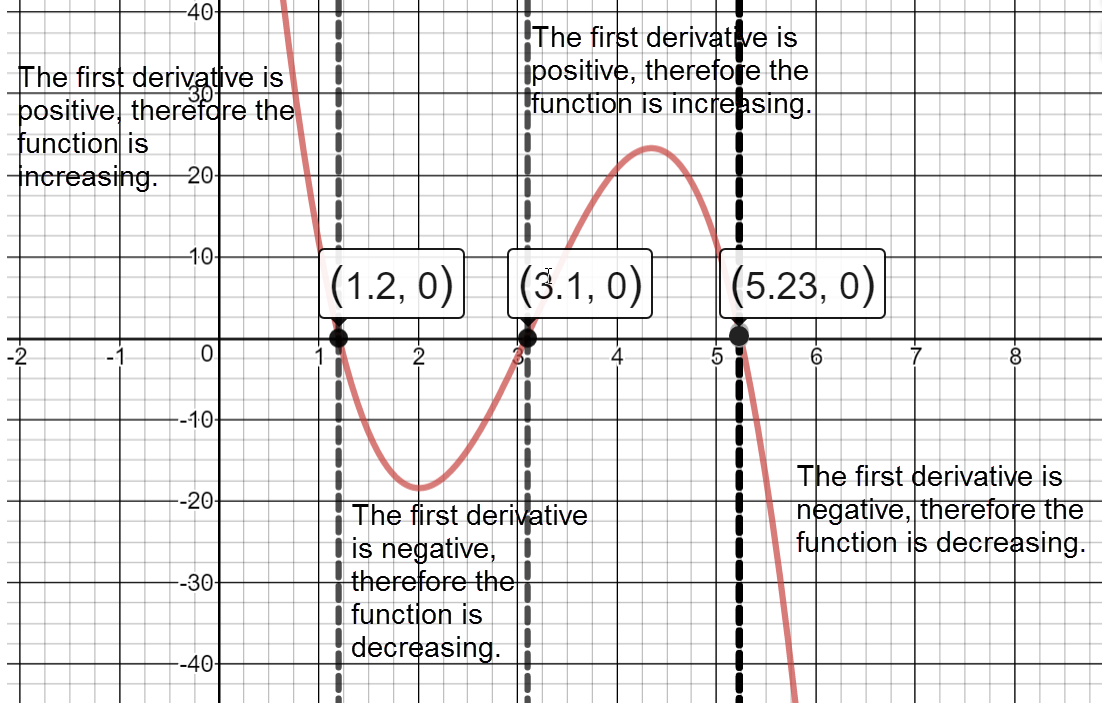
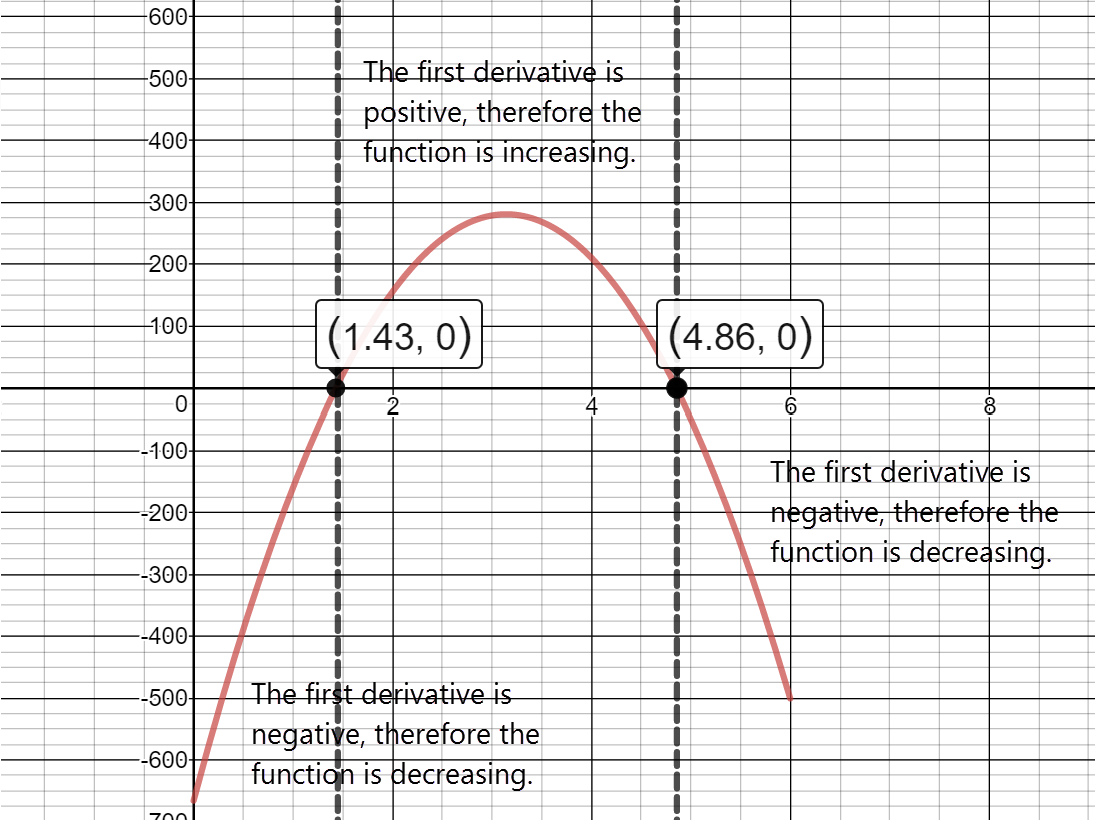
      Sign graph of ${A}'(x)$ from left: positive, ${A}'\left( 1.20 \right)\approx 0$, negative, ${A}'\left( 3.10 \right)\approx 0$, positive, ${A}'\left( 5.23 \right)\approx 0$, negative

      Determine the intervals on which $A(t)$ is increasing/decreasing.

      The function is increasing on the intervals: $\left( 0,1.20 \right)\cup \left( 3.10,5.23 \right).$

      APR increased from 2008 into 2009 and from 2011 into 2013.

      The function is decreasing on the intervals: $\left( 1.20,3.10 \right)\cup \left( 5.23,6 \right).$

      APR decreased from 2009 into 2011 and in 2013.

    2. Identify local maxima and minima for $A(t)$.

      There are two Local Maxima at the points: $\left( 1.20,25.92 \right)$ and $\left( 5.23,34.50 \right).$

      There is a Local Minimum at the point: $\left( 3.10,2.90 \right).$

3.2 First Derivative Test Homework

Use the First Derivative Test to analyze the function. Identify intervals of increase/decrease and extrema on the graph of the function.

  1. $f(x)=3{{x}^{2}}+5x-2$

    1. Increasing and Decreasing

      ${f}'(x)=6x+5$

      Values of x where ${f}'(x)=0:$

      $6x+5=0$

      $6x=-5$

      $x=-\frac{5}{6}$

      Values of x where ${f}''\left( x \right)\;$is undefined:

      There are no values of x where ${f}''\left( x \right)\;$is undefined.

      Values of x where $f\left( x \right)\;$is undefined:

      There are no values of x where $f\left( x \right)\;$is undefined.

      Separate into intervals using: $x=-\frac{5}{6}$.

      Image of graph of F prime of x as it relates to the x axis. Separates graph into intervals divided by partitions where F prime equals zero, or is undefined.  Also indicates intervals where derivative is positive and intervals where derivative is negative.
      Sign graph of ${f}'(x)$ reading left to right: negative, ${f}'\left( -\frac{5}{6} \right)=0$ , positive

      Increasing:

      The graph of $f(x)$ is increasing on the interval $\left( -\frac{5}{6},\infty \right)$.

      Decreasing:

      The graph of $f(x)$ is decreasing on the interval $\left( -\infty ,-\frac{5}{6} \right)$.

    2. local max:

      There are no local maxima.

      local min:

      $f\left( -\frac{5}{6} \right)=3{{\left( -\frac{5}{6} \right)}^{2}}+5\left( -\frac{5}{6} \right)-2\approx 4.08$

      There is a local minimum at the point $\left( -\frac{5}{6},-4.08 \right)$.

      blank 4 quadrant coordinate plane

      Graph of F of x indicating intervals of increase, intervals of decrease, local maxima and local minima

  2. $f(x)=\frac{4x-7}{5x+1}$

    1. Increasing and Decreasing

      ${f}'\left( x \right)=\frac{4\left( 5x+1 \right)-5\left( 4x-7 \right)}{{{\left( 5x+1 \right)}^{2}}}=\frac{20x+4-20x+35}{{{\left(5x+1 \right)}^{2}}}=\frac{39}{{{\left(5x+1 \right)}^{2}}}$

      Values of x where ${f}'\left( x \right)=0:$

      $\frac{0}{1}=\frac{39}{{{\left( 5x+1 \right)}^{2}}}$

      $39 \neq 0$. There are no values of x where ${f}'\left( x \right)=0.$

      Values of x where ${f}'\left( x \right)$ is undefined:

      $5x+1=0$, $ x=-\frac{1}{5}$

      Values of x where $f\left( x \right)$ is undefined:

      $5x+1=0$, $ x=-\frac{1}{5}$

      Separate into intervals using: $x=-\frac{1}{5}$.

      Image of graph of F prime of x as it relates to the x axis. Separates graph into intervals divided by partitions where F prime equals zero, or is undefined.  Also indicates intervals where derivative is positive and intervals where derivative is negative.
      Sign graph of ${f}'(x)$ reading left to right: positive, ${f}'\left( -\frac{1}{5} \right)\text{= undefined}$, positive

      Increasing:

      $\left( -\infty ,-\frac{1}{5} \right)\cup \left( -\frac{1}{5},\infty \right)$ The graph of the first derivative is always above the x axis. Therefore, the function is increasing over the entire domain.

      Decreasing:

      The graph of the first derivative is always above the x axis. Therfore, there are no intervals where $f(x)$ is decreasing.

    2. Local Maxima:

      The first derivative never changes from positive to negative. There are no local maxima.

      Local Minima:

      The first derivative never changes from negative to positive. There are no local minima.

      blank 4 quadrant coordinate plane

      Graph of f of x indicating intervals of increase, intervals of decrease, local maxima and local minima

  3. Using data from Statista, the total annual amount spent on the purchase of golf equipment in the United States for the years 2008-2014 can be modeled by the following equation:

    $$A(t)=-31.94{{t}^{3}}+301.16{{t}^{2}}-665.61t+3454.63$$ where t is in years since 2008 and A(t) is in millions of dollars.

    Source: href="https://www.statista.com/statistics/201038/purchases-of-golf-equipment-in-the-us-since-2007/">http://www.statista.com/statistics/201038/purchases-of-golf-equipment-in-the-us-since-2007/

    Use the First Derivative Test to analyze the function. Identify intervals of increase/decrease and extrema on the graph of the function.

    ${A}'\left( t \right)=-95.82{{t}^{2}}+602.32t-665.61$

    1. Graph the critical numbers on a number line and determine the sign for each interval.

      Values of t where ${A}'\left( t \right)=0:$

      $t=1.43$ and $t=4.86$

      Values of t where ${A}'\left( t \right)$ is undefined:

      There are no values of t where ${A}'\left( t \right)$is undefined.

      Values of t where ${A}\left( t \right)$ is undefined:

      There are no values of t where $A\left( t \right)$ is undefined.

      Separate into intervals using: $t=1.43$ and $t=4.86$.

      Graph of the first derivative of the function A of t
      Sign chart for ${A}'\left( t \right)$ reading left to right: negative, ${A}'\left( 1.43 \right)\approx 0$, positive, ${A}'\left( 4.86 \right)\approx 0$, negative

      Determine the intervals on which $A(t)$ is increasing/decreasing.

      The function is increasing on the interval: $\left( 1.43,4.86 \right).$

      From 2009 to 2012, purchase amounts of golf equipment in the US increased each year.

      The function is decreasing on the intervals: $\left( 0,1.43 \right)\cup \left( 4.86,6 \right).$

      In 2008 into 2009 and in 2013 and 2014, purchase amounts of golf equipment decreased.

    2. Identify local maxima and minima for $A(t)$.

      There is a Local Maximum at the point: $\left( 4.86,3666.61 \right).$

      There is a Local Minimum at the point: $\left( 1.43,3025.25 \right).$


Additional Resources