MATH 1830

Unit 3 Applications of Derivatives

3.4 A Summary of Curve Sketching

Pre-Class:

NearPod: Derivative Rules

  1. Which rule would you use to find the rate of change for the function $f(x)=x^3\left(2x^2+3x-7\right)$?
    • Power Rule
    • e Rule
    • ln Rule
    • Product Rule
    • Quotient Rule
    • Chain Rule
  2. Which rule would you use to find the derivative of the function $f(x)=\left(2x+7\right)^2$?
    • Power Rule
    • e Rule
    • ln Rule
    • Product Rule
    • Quotient Rule
    • Chain Rule
  3. Which rule would you use to find the rate of change for the function $f(x)=4e^x$?
    • Power Rule
    • e Rule
    • ln Rule
    • Product Rule
    • Quotient Rule
    • Chain Rule
  4. Which rule would you use to find the derivative of the function $y=\frac{x^2+3x-7}{x}$?
    • Power Rule
    • e Rule
    • ln Rule
    • Product Rule
    • Quotient Rule
    • Chain Rule
  5. Which rule would you use to find the rate of change for the function $g(x)=\frac{x^3}{\left(x+1\right)\left(x-3\right)}$?
    • Power Rule
    • e Rule
    • ln Rule
    • Product Rule
    • Quotient Rule
    • Chain Rule
  6. Which rule would you use to find the derivative of the function $y=e^x \sqrt x$?
    • Power Rule
    • e Rule
    • ln Rule
    • Product Rule
    • Quotient Rule
    • Chain Rule

Nearpod Activity: First Derivative Test

graph of f(x) = x^4+x^3-3x^2+1 on the domaim from -5 to 5.

  1. Draw and label 3 lines tangent to the function.

    1. a tangent line with a positive slope
    2. tangent line with a negative slope
    3. a tangent line with a slope of zero
  2. graph of f(x) = x^4+x^3-3x^2+1 on the domaim from -5 to 5 with points marked at (-1.656, -4.248), (0, 1), and (0.906, -0.045).
  3. Use different colors to mark the intervals where the function is increasing and decreasing. Include a color legend.
  4. State the intervals where the function is:
    1. Increasing
    2. Decreasing

Nearpod Activity: Second Derivative Test

graph of f(x) = x^4+x^3-3x^2+1 on the domaim from -5 to 5 with points marked at (-1, -2), and (0.5, 0.438).
  1. Use different colors to mark the intervals where the function is concave up and concave down. Include a color legend.
  2. State the intervals where the function is:
    1. Concave Up
    2. Concave Down
  3. Verixon Wireless connections in millions versus revenue in billions of dollars for the years 2006-2011.  Will require a tactile graph.  Please see your instructor.
    1. Describe what is happening to the revenue from 2006 until mid-2008.
    2. Describe what is happening to the revenue from mid-2008 until 2011.

Nearpod Activity: Derivative Analysis

graph of f(x) = -2x^5+6x^4+x^3-10x^2+6 with marked points A-E.  Point A is at x=-1.014.  Point B is at x=1.151.  Point C is at x=0.  Point D is at x=1.65.  Point E is at x=2.28.

FIRST DERIVATIVE TEST:

In the first blank of each statement, choose one: positive, negative, equal to zero.

In the second blank of each statement, choose one: increasing, decreasing, has a horizontal tangent.

  1. At Point A, $f'(x)$ is , therefore the graph (is) .
  2. At Point B, $f'(x)$ is , therefore the graph (is) .
  3. At Point C, $f'(x)$ is , therefore the graph (is) .
  4. At Point D, $f'(x)$ is , therefore the graph (is) .
  5. At Point E, $f'(x)$ is , therefore the graph (is) .

graph of f(x) = -2x^5+6x^4+x^3-10x^2+6 with marked points A-E.  Point A is at x=-1.014.  Point B is at x=1.151.  Point C is at x=0.  Point D is at x=1.65.  Point E is at x=2.28.

SECOND DERIVATIVE TEST:

In the first blank of each statement, choose one: positive, negative, equal to zero.

In the second blank of each statement, choose one: concave up, concave down, has a possible point of inflection.

  1. At Point A, $f''(x)$ is , therefore the graph (is) .
  2. At Point B, $f''(x)$ is , therefore the graph (is) .
  3. At Point C, $f''(x)$ is , therefore the graph (is) .
  4. At Point D, $f''(x)$ is , therefore the graph (is) .
  5. At Point E, $f''(x)$ is , therefore the graph (is) .

3.4 Curve Sketching Homework

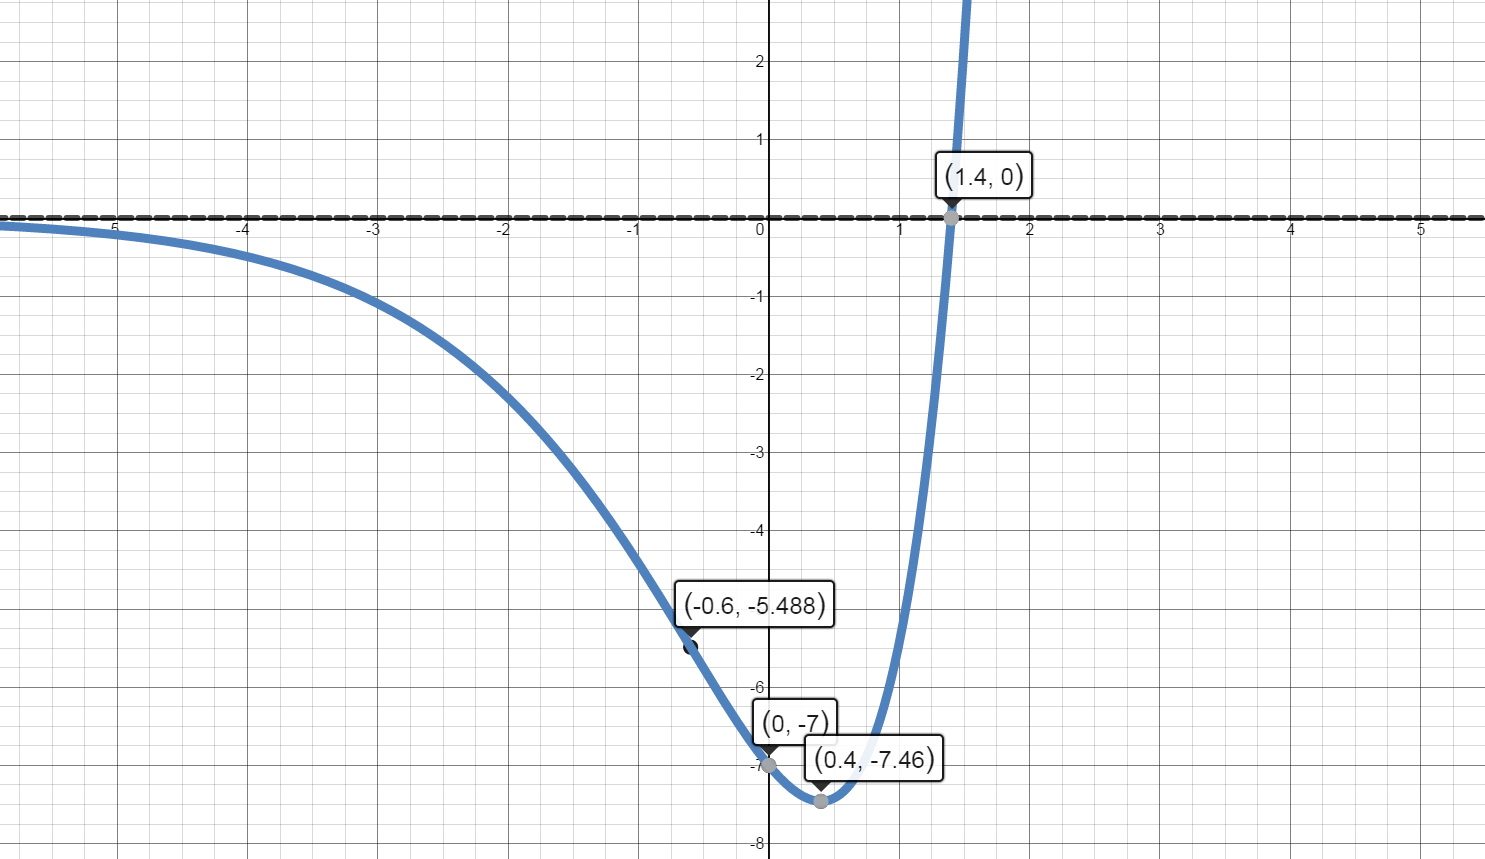
  1. $f(x)={{e}^{x}}(5x-7)$

    Domain:

    $\left( -\infty ,\infty \right)$

    x int(s):

    $0={{e}^{x}}(5x-7)$

    $5x-7=0$

    $x=\frac{7}{5}$

    ${{e}^{x}}=0$

    no solution

    $\left( \frac{7}{5},0 \right)$

    y int:

    $f\left( 0 \right)={{e}^{0}}\left( 5\left( 0 \right)-7 \right)=-7$

    $\left( 0,-7 \right)$

    Asymptotes:

    Vertical:

    There are no vertical asymptotes. The function is continuous for all x.

    Horizontal:

    $\mathop {\lim }\limits_{x \to \infty }\left( {{e}^{x}}(5x-7) \right)=\infty $

    $\mathop {\lim }\limits_{x \to -\infty }\left( {{e}^{x}}(5x-7) \right)=0$

    There is a horizontal asymptote at $y=0$ on the left end of the graph.

    Increasing and Decreasing

    ${f}'\left( x \right)={{e}^{x}}\left( 5x-7 \right)+5{{e}^{x}} $

    $f’(x) ={{e}^{x}}\left( 5x-7+5 \right)$

    $f’(x) ={{e}^{x}}\left( 5x-2 \right)$

    Values of x where ${f}'\left( x \right)=0:$

    ${{e}^{x}}\left( 5x-2 \right)=0$

    $e^x \ne 0$ and $x=\frac{2}{5}$

    Values of x where ${f}'\left( x \right)\;$ is undefined: There are no values of x where ${f}'\left( x \right)\;$ is undefined.

    Values of x where $f\left( x \right)\;$ is undefined: There are no values of x where $f\left( x \right)\;$ is undefined.

    Separate into intervals using: $x=\frac{2}{5}$.

    Image of graph of F prime of x as it relates to the x axis. Separates graph into intervals divided by partitions where F prime equals zero, or is undefined.  Also indicates intervals where derivative is positive and intervals where derivative is negative.

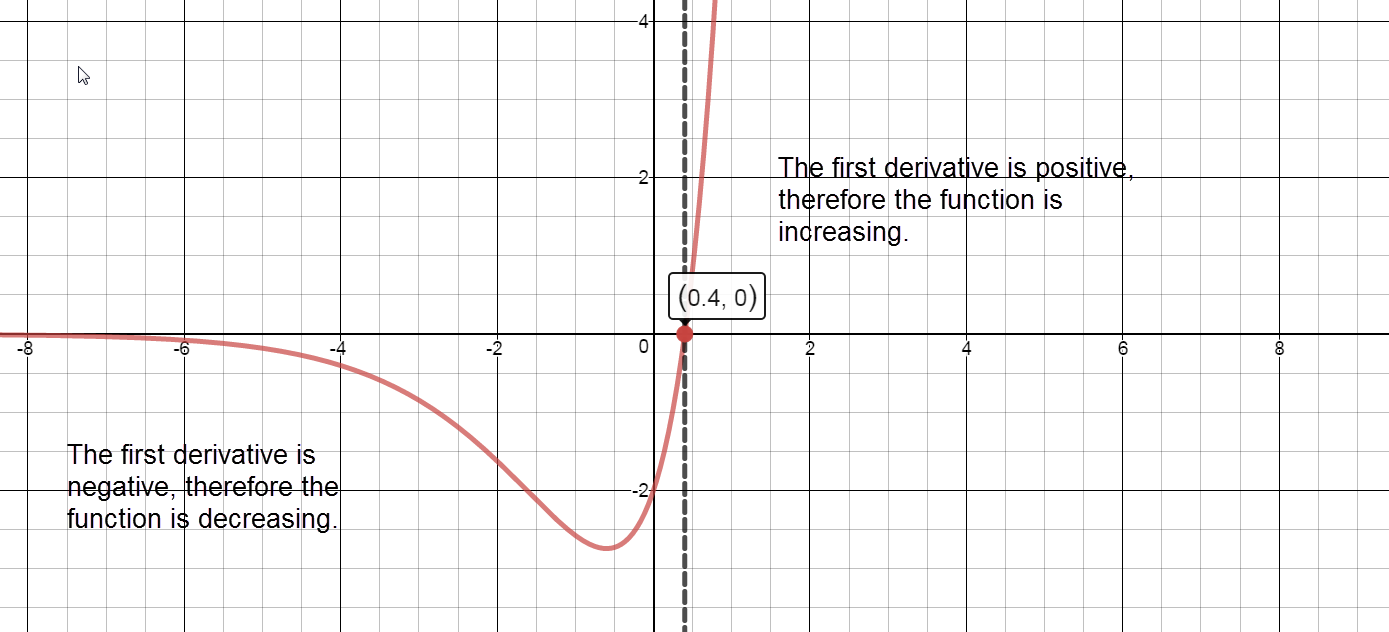
    Sign graph of ${f}'(x)$ reading left to right: negative, ${f}'\left( \frac{2}{5} \right)=0$, positive

    Increasing:

    The graph of $f(x)$ is increasing on the interval $\left( \frac{2}{5},\infty \right).$

    Decreasing:

    The graph of $f(x)$ is decreasing on the interval $\left( -\infty ,\frac{2}{5} \right).$

    Local Maxima:

    There are no local maxima.

    Local Minima:

    $f\left( \frac{2}{5} \right)={{e}^{2/5}}\left( 5\left( \frac{2}{5} \right)-7 \right)\approx -7.46$

    There is a local minimum at the point $\left( \frac{2}{5},-7.46 \right).$

    Concave Up and Concave Down

    ${f}''\left( x \right)={{e}^{x}}\left( 5x-2 \right)+{{e}^{x}}\left( 5 \right)$

    ${f}''\left( x \right)={{e}^{x}}\left( 5x-2+5 \right)$

    ${f}''\left( x \right)={{e}^{x}}\left( 5x+3 \right)$

    Values of x where ${f}''(x)=0:$

    ${{e}^{x}}\left( 5x+3 \right)=0$

    $x=-\frac{3}{5}$

    ${{e}^{x}}\ne 0$

    Values of x where ${f}''\left( x \right)\;$is undefined:

    There are no values of x where ${f}''\left( x \right)\;$is undefined.

    Values of x where $f\left( x \right)\;$is undefined:

    There are no values of x where $f\left( x \right)\;$is undefined.

    Separate into intervals using: $x=-\frac{3}{5}$.

    Graph of Second Derivative of f of x  and how it relates to the x axis.  Intervals are separated by values of x where the second derivative equals 0 or is undefined.  Values where f of x is undefined also serve to segment intervals.  The graph indicates intervals where the second derivative of f of x  is positive and where the second derivative is negative.

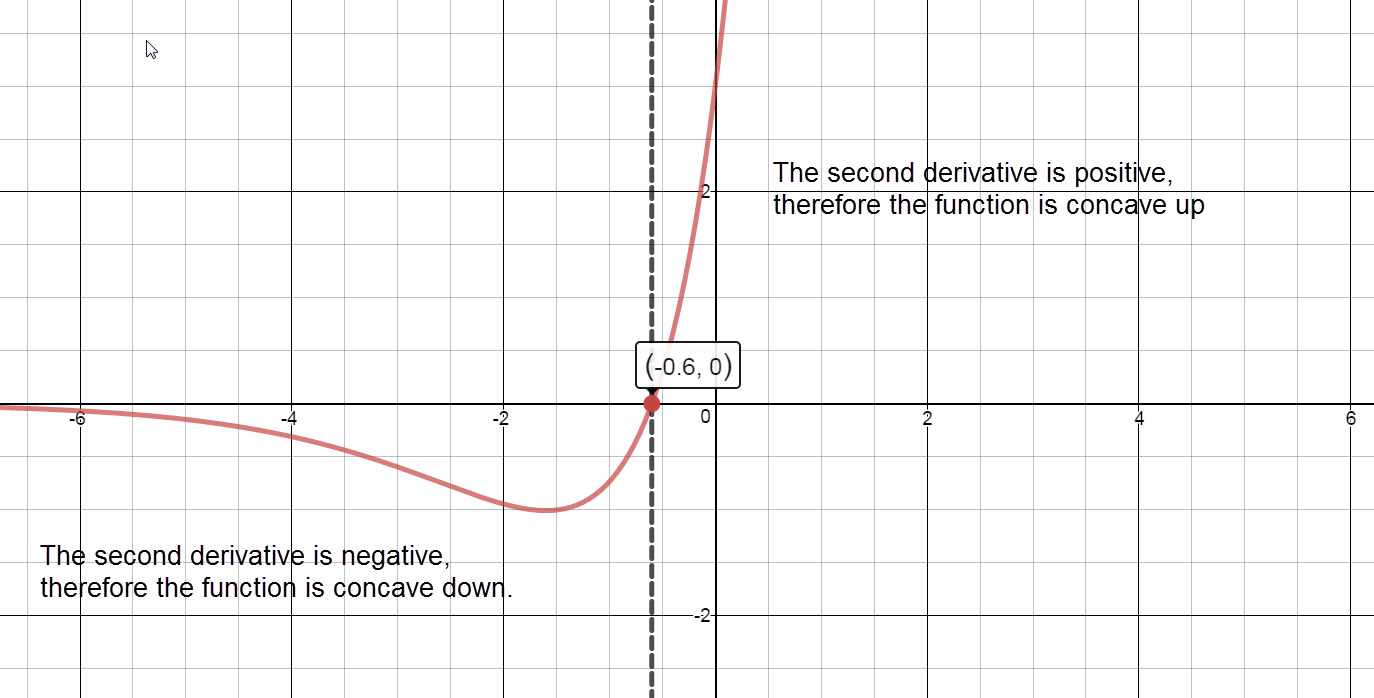
    Sign chart for ${f}''\left( x \right)$: negative, ${f}''\left( -\frac{3}{5} \right)=0$, positive

    Concave up:

    The graph of $f(x)$ is concave up on the interval $\left( -\frac{3}{5},\infty \right)$.

    Concave down:

    The graph of $f(x)$ is concave down on the interval $\left( -\infty ,-\frac{3}{5} \right)$.

    Inflection Points:

    $f\left( -\frac{3}{5} \right)={{e}^{-3/5}}\left( 5\left( -\frac{3}{5} \right)-7 \right)\approx -5.488$.

    There is a point of inflection at $\left( -\frac{3}{5},-5.488 \right)$

    blank 4 quadrant coordinate plane

    Graph of F of x indicating intervals of increase, intervals of decrease, local maxima and local minima