4.1 Area by Sums
Pre-Class:
- Take notes on the videos and readings (use the space below).
- Work and check problem #1 in the 4.1 NOTES section.
- Complete the 4.1 Pre-Class Quiz.
Introduction
-
The rate of change of the population (in thousands of people per year) of North Dakota between 1985 and 1996 can be modeled by
$p(t)= \begin{cases} -7.35 & 0\leq t\leq 6 \\ 2.5 & 6 \lt t \leq 11\\ \end{cases} $ where t represents the number of years since 1985.
(Source: Statistical Abstract, 1998)
- Sketch a graph of the rate of change function.
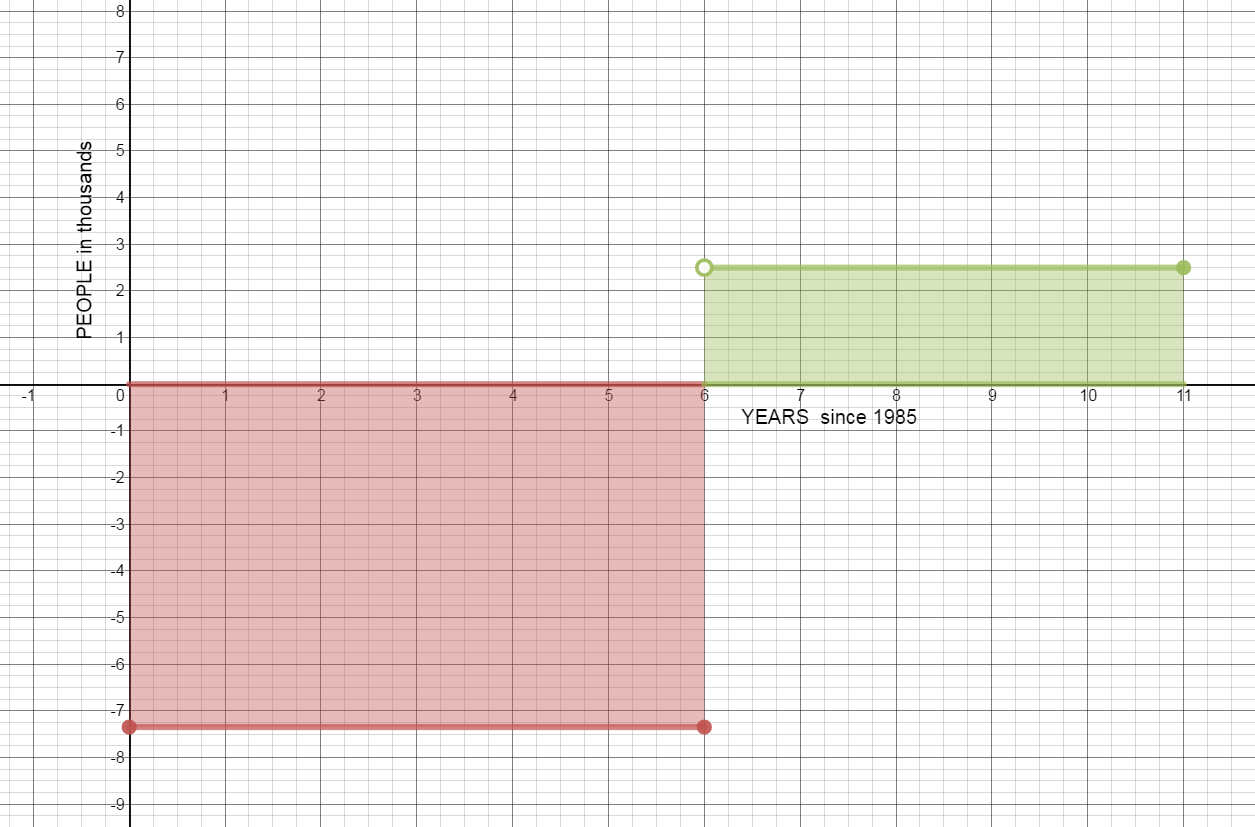
- Find the area of the region between the graph of p and the horizontal axis from 0 to 6. Interpret your answer.
$A=lw$
$A=7.35(6)$
$A=44.1$
There was a 44.1 thousand person decrease in population between 1985 and 1991.
- Find the area of the region between the graph of p and the horizontal axis from 6 to 11. Interpret your answer.
$A=lw$
$A=2.5(5)$
$A=12.5$
There was a 12.5 thousand person increase in population between 1991 and 1996.
- Was the population of North Dakota in 1996 greater or less than the population in 1985? By how much did the population change between 1985 and 1996?
$-44.1+12.5=-31.6$
In 1996 the population of North Dakota was 31.6 thousand people fewer than in 1985.
- What information would you need to determine the population of North Dakota in 1996?
We need to know the population of North Dakota in 1985. If we know the population count for 1985, we can calculate the population in 1996 by subtracting 31,600 from the 1985 population count.
- What is the relationship between the area of the regions and the population of North Dakota?
Each area represents the total change in population for the time period.
- Sketch a graph of the rate of change function.
-
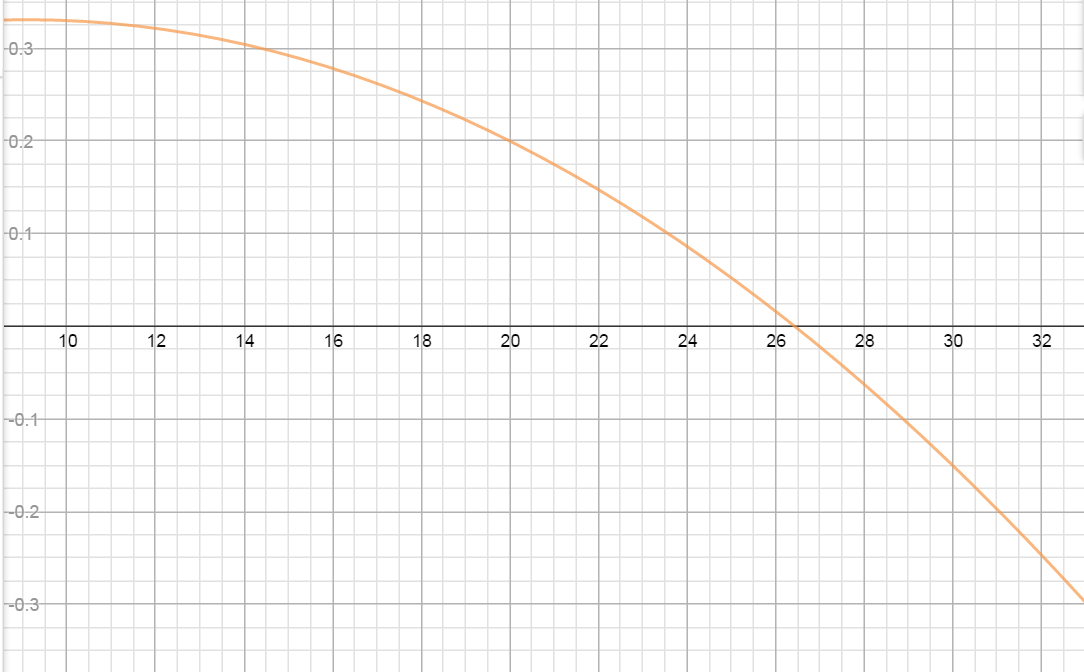
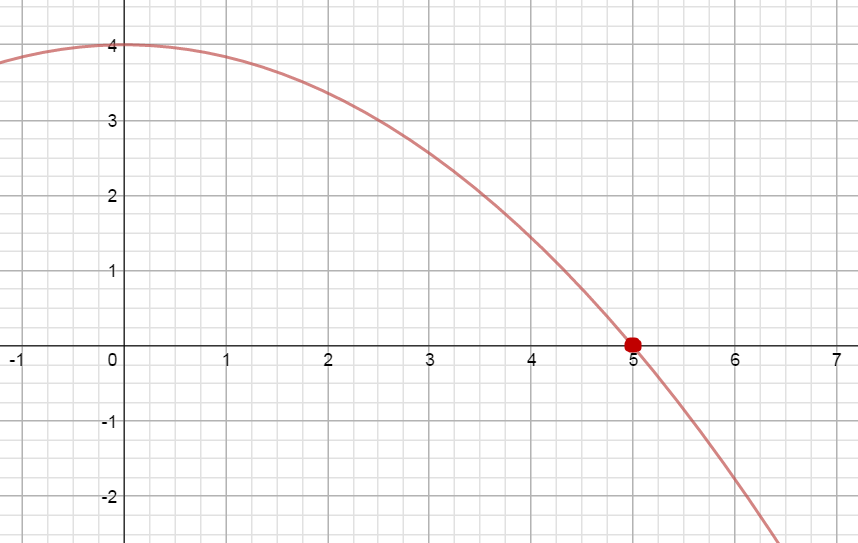
An office worker assembles advertising portfolios. As fatigue sets in, the number of portfolios he can assemble per hour decreases. Using regression, it is determined that he can assemble $f\left( t \right) = 20 - {t^2}$ portfolios per hour $t$ hours after he begins work.
- How many portfolios can he assemble in the third hour?
$f(3) = 20 - {\left( 3 \right)^2} = 20 - 9 = 11$
The office worker assembles 11 portfolios in the third hour.
- Graph the equation on the interval [0,3] on the graph below and approximate the area under the curve using three left rectangles.
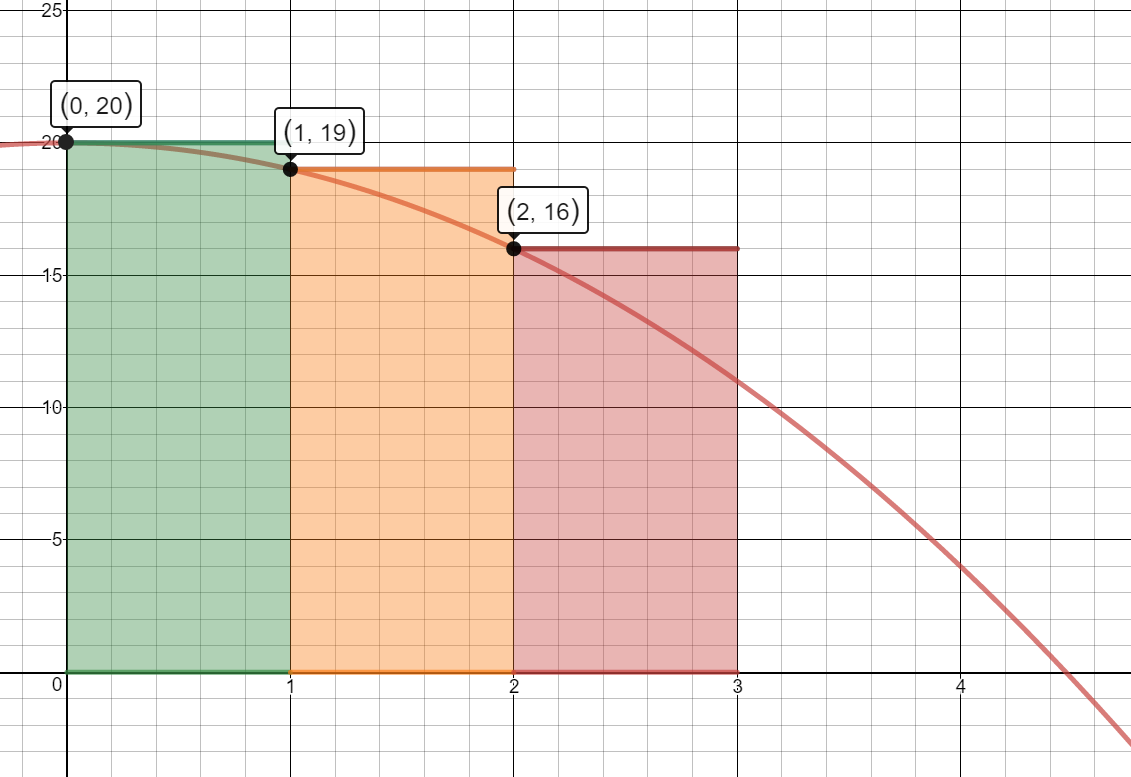
3 Left Rectangles
$A\approx A1 + A2 + A3=1[f(0)] + 1[f(1)] + 1[f(2)]$
$A\approx1(20) + 1(19) + 1(16)$
$A\approx 20+19+16$
$A\approx 55$
The worker can assemble approximately 55 portfolios in 3 hours.
- Find the area under the curve using 6 left rectangles and then 9 left rectangles.
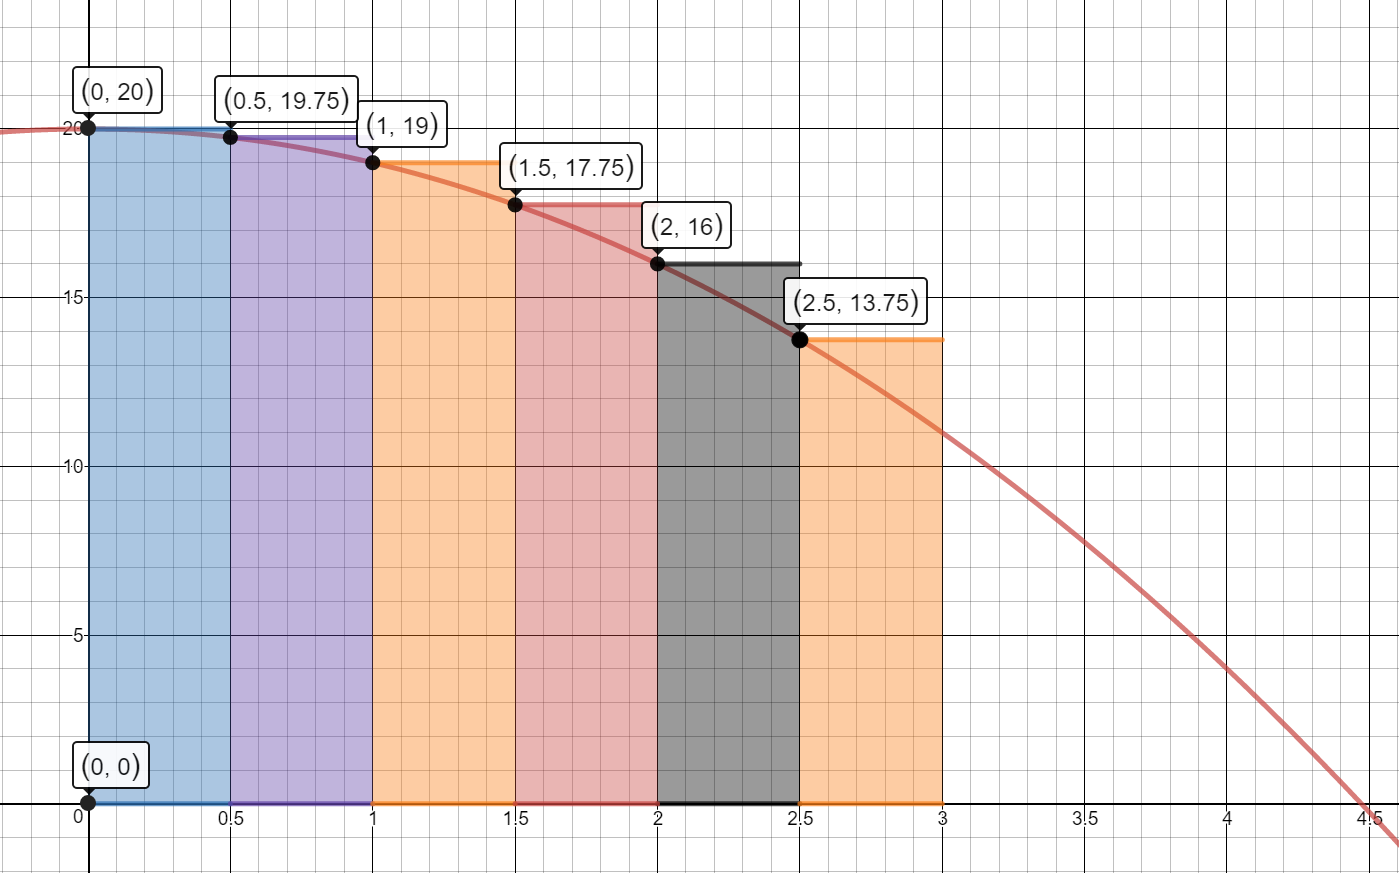
6 Left Rectangles
$A \approx A1 + A2 + A3 + A4 + A5 + A6$
$A \approx .5[f(0)] + .5[f(.5)] + .5[f(1)] + .5[f(1.5)] + .5[f(2)] + .5[f(2.5)]$
$A\approx.5(20) + .5(19.75) + .5(19) + .5(17.75) + .5(16) + .5(13.75)$
$A\approx10 + 9.875 + 9.5 + 8.875 + 8 + 6.875$
$A\approx53.125$
The worker can assemble approximately 53.125 portfolios in 3 hours.
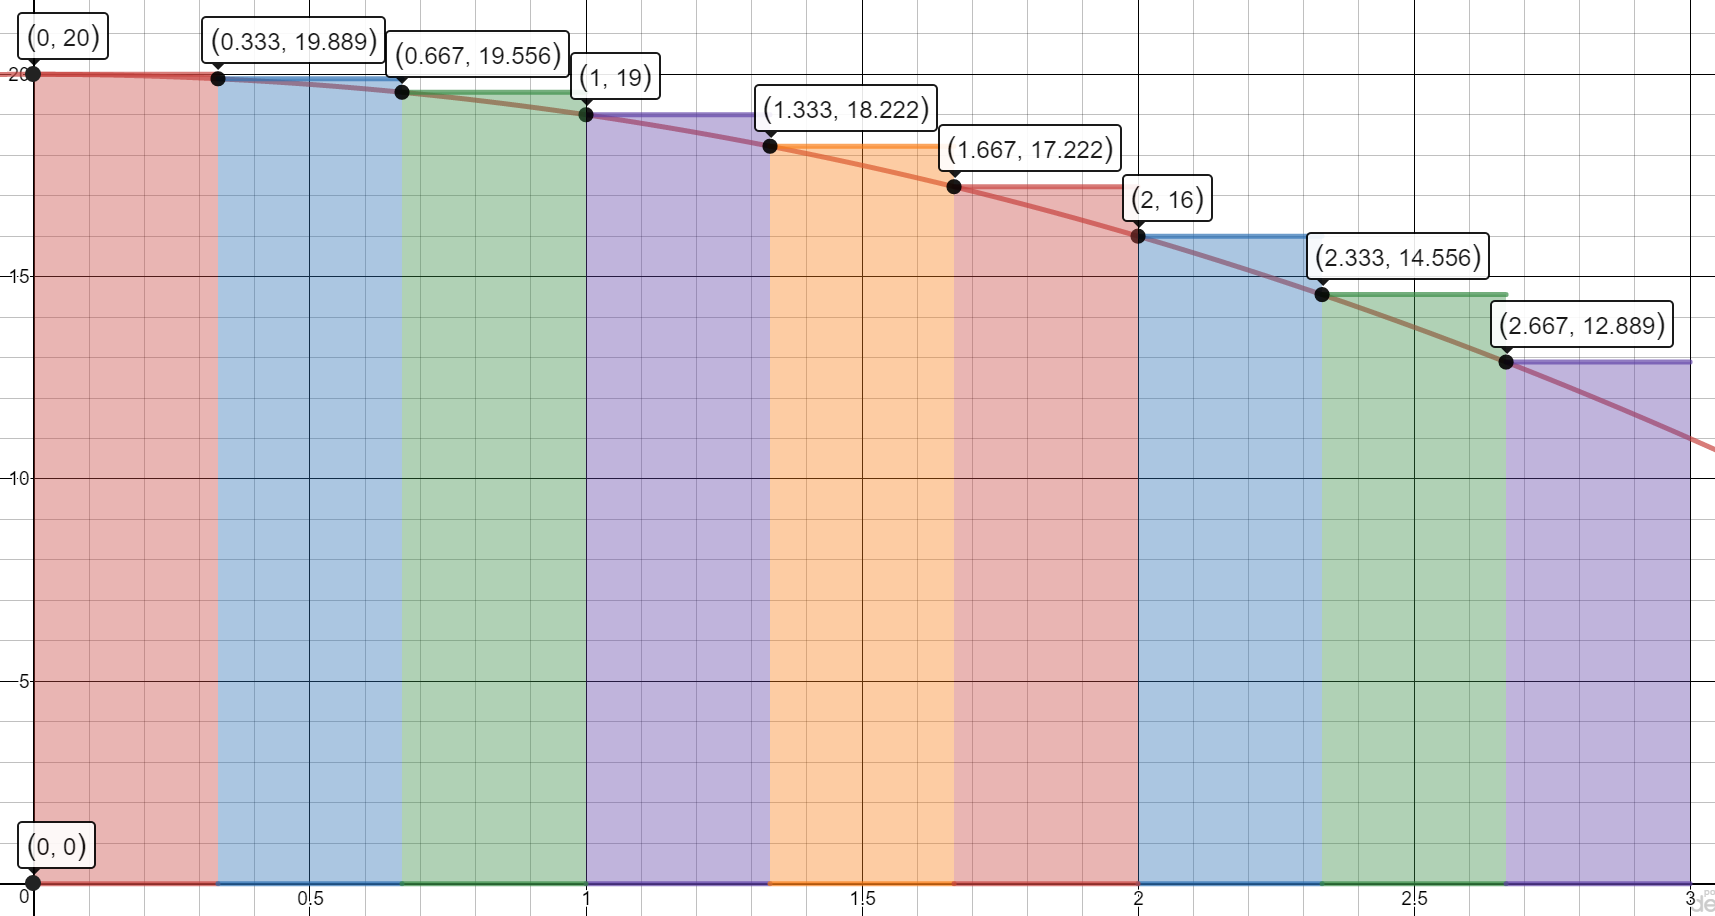
9 Left Rectangles
A \approx A1 + A2 + A3 + A4 + A5 + A6 + A7 + A8 + A9
$A \approx \frac{1}{3}[f(0)] + \frac{1}{3}[f(\frac{1}{3})] + \frac{1}{3}[f(\frac{2}{3})] + \frac{1}{3}[f(1)] + \frac{1}{3}[f(\frac{4}{3})]+ \frac{1}{3}[f(\frac{5}{3})] + \frac{1}{3}[f(2)] + \frac{1}{3}[f(\frac{7}{3})] + \frac{1}{3}[f(\frac{8}{3})]$
$A\approx\frac{1}{3}(20) + \frac{1}{3}(19.889) + \frac{1}{3}(19.556) + \frac{1}{3}(19) + \frac{1}{3}(18.222)+ \frac{1}{3}(17.222) + \frac{1}{3}(16) + \frac{1}{3}(14.556) + \frac{1}{3}(12.889)$
$A\approx52.444$
The worker can assemble approximately 52.444 portfolios in 3 hours.
- Do you think using 3 or 6 or 9 rectangles is a more accurate measure of the area? What could you do to get an even better measure?
Using 9 rectangles is the more accurate measure of the area. We would get even an even better measure of the area if we used more rectangles.
- What does the area under the curve represent?
The area under the curve represents the total number of portfolios the worker can assemble in the given time period.
- How many portfolios can he assemble in the third hour?
Notes
-
Estimate the area under the curve $f(x) = {x^2}$ on the domain [0,4] by summing the areas of the four Right Hand Rectangles. Is your estimate greater than the actual area or less than the actual area?
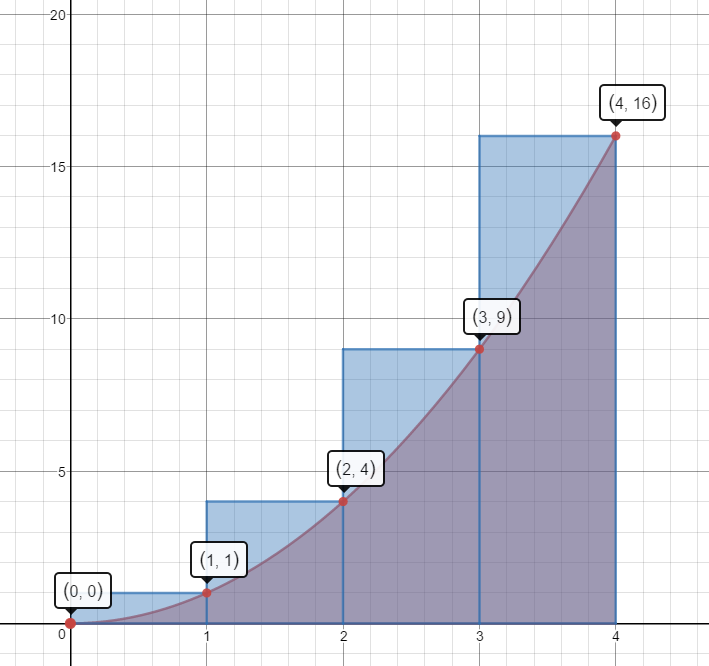
$A\approx 1(1)+1(4)+1(9)+1(16)=1+4+9+16=30\;units^2$
This estimate is more than the actual area.
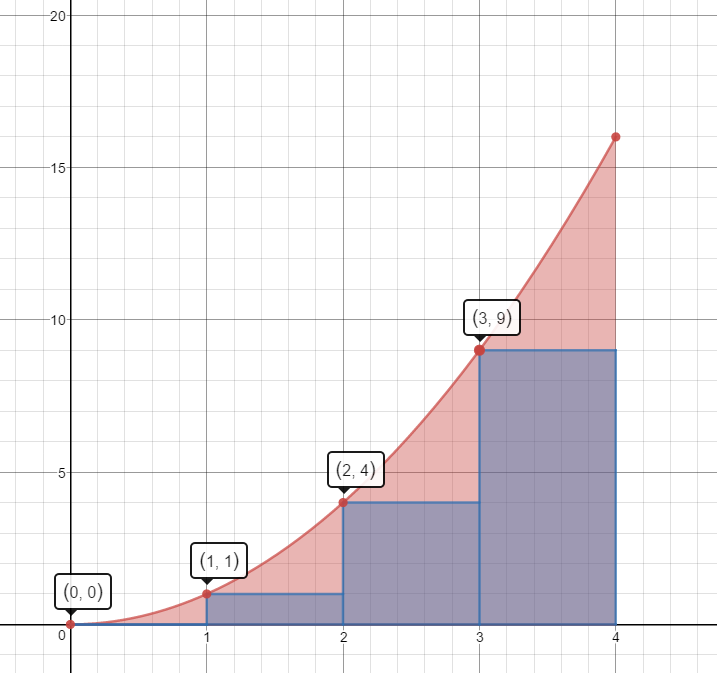
Left Hand Rectangles
$A\approx1(0)+1(1)+1(4)+1(9)=0+1+4+9=14\;units^2$
This estimate is less than the actual area.
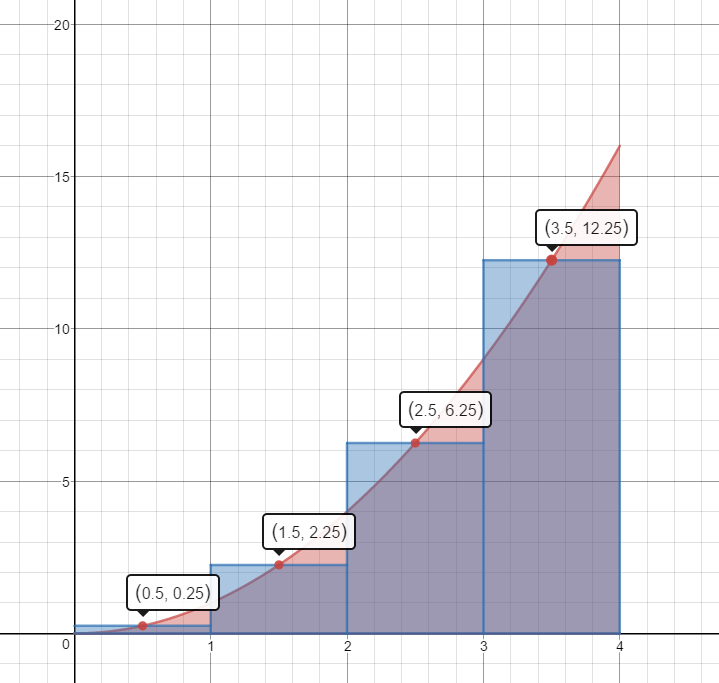
Mid-Point Rectangles
$A\approx 1(.25)+1(2.25)+1(6.25)+1(12.25)=.25+2.25+6.25+12.25=21\;units^2$
This estimate is slightly less than the actual area.
-
Use 3 Right Hand Rectangles to estimate the area under the curve $f(x) = 2x$ on the domain [1,4].
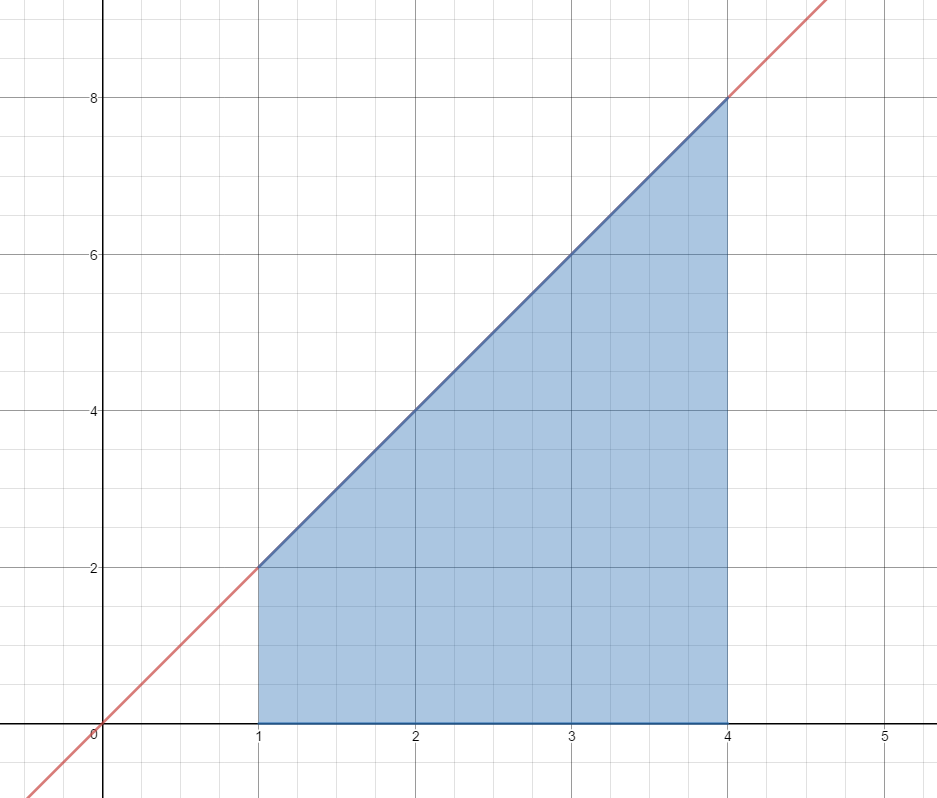
$A\approx1(4)+1(6)+1(8)$
$A\approx4+6+8$
$A\approx 18\;units^2$
Is this estimate less than the actual area or greater than the actual area?
This estimate is more than the actual area.
-
Use 3 Mid-Point Rectangles to estimate the area under the curve $f(x) = {x^3}$ on the domain [1,4].
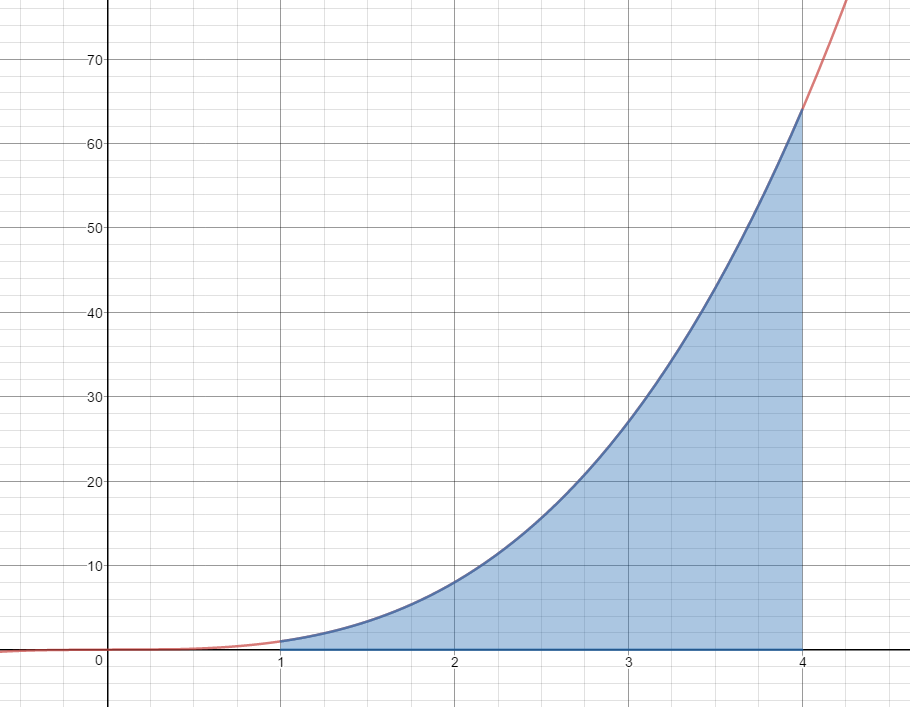
$A\approx 1{(1.5)^3} + 1{(2.5)^3} + 1{(3.5)^3}$
$A\approx 3.375 + 15.625 + 42.875$
$A\approx 61.875\;units^2$
Is this estimate less than the actual area or greater than the actual area?
This estimate is less than the actual area.
-
Use 3 Left Hand Rectangles to estimate the area under the curve $f(x) = \frac{1}{x}$ on the domain [0.5, 2.0].
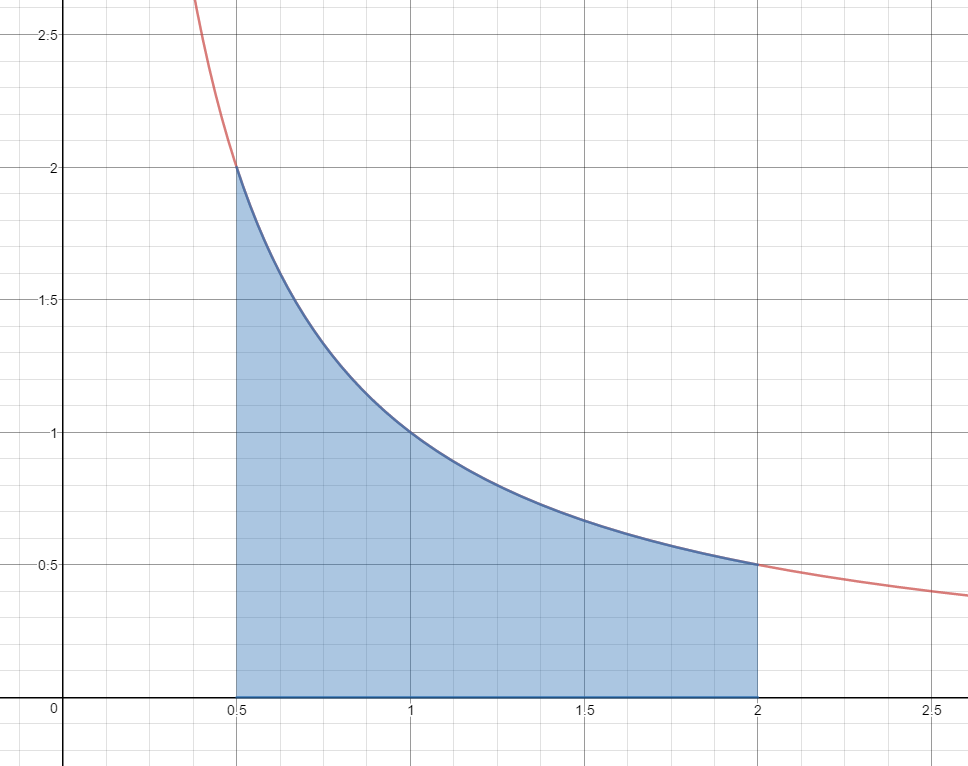
$A\approx \frac{1}{2}\left( {\frac{1}{{.5}}} \right) + \frac{1}{2}\left( {\frac{1}{1}} \right) + \frac{1}{2}\left( {\frac{1}{{1.5}}} \right)$
$A\approx \frac{1}{2}(2) + \frac{1}{2}(1) + \frac{1}{2}\left( {\frac{2}{3}} \right)$
$A\approx 1 + \frac{1}{2} + \frac{1}{3}$
$A\approx 1.83\;units^2$
Is this estimate less than the actual area or greater than the actual area?
This estimate is greater than the actual area.
 approximate the area under the curve on the interval [0, 6] using 6 right rectangles.